This opinion article was written by Environmental Data Scientist Dr. Sambadi Majumder.
At GWSC, we work with various types of data daily, and one of the challenges we face is presenting the information in a way that’s easy to interpret and engaging.
We often use statistical charts and maps, but another interesting way to share complex data that recently caught my attention is data sonification, or the process of translating data into sound. Unlike traditional visualizations, sonification uses auditory cues to convey information, thus potentially enhancing accessibility as well as comprehension of the underlying data.
A sonified data product is a tangible, dynamic, sensory-driven representation of data. A recent application of data sonification in earth science include the audio representation of the Normalized Difference Vegetation Index (NDVI) from the harmonized Landsat Sentinel-2 dataset offers a novel way to explore vegetation dynamics. By mapping NDVI values to sound parameters such as pitch, volume, and timbre, researchers created auditory representations of vegetation changes over time. Researchers mapped the NDVI data values to MIDI chords and chord velocity levels, resulting in a unique auditory experience that highlights the seasonal trends of vegetation. You can find a video demonstrating the product here.
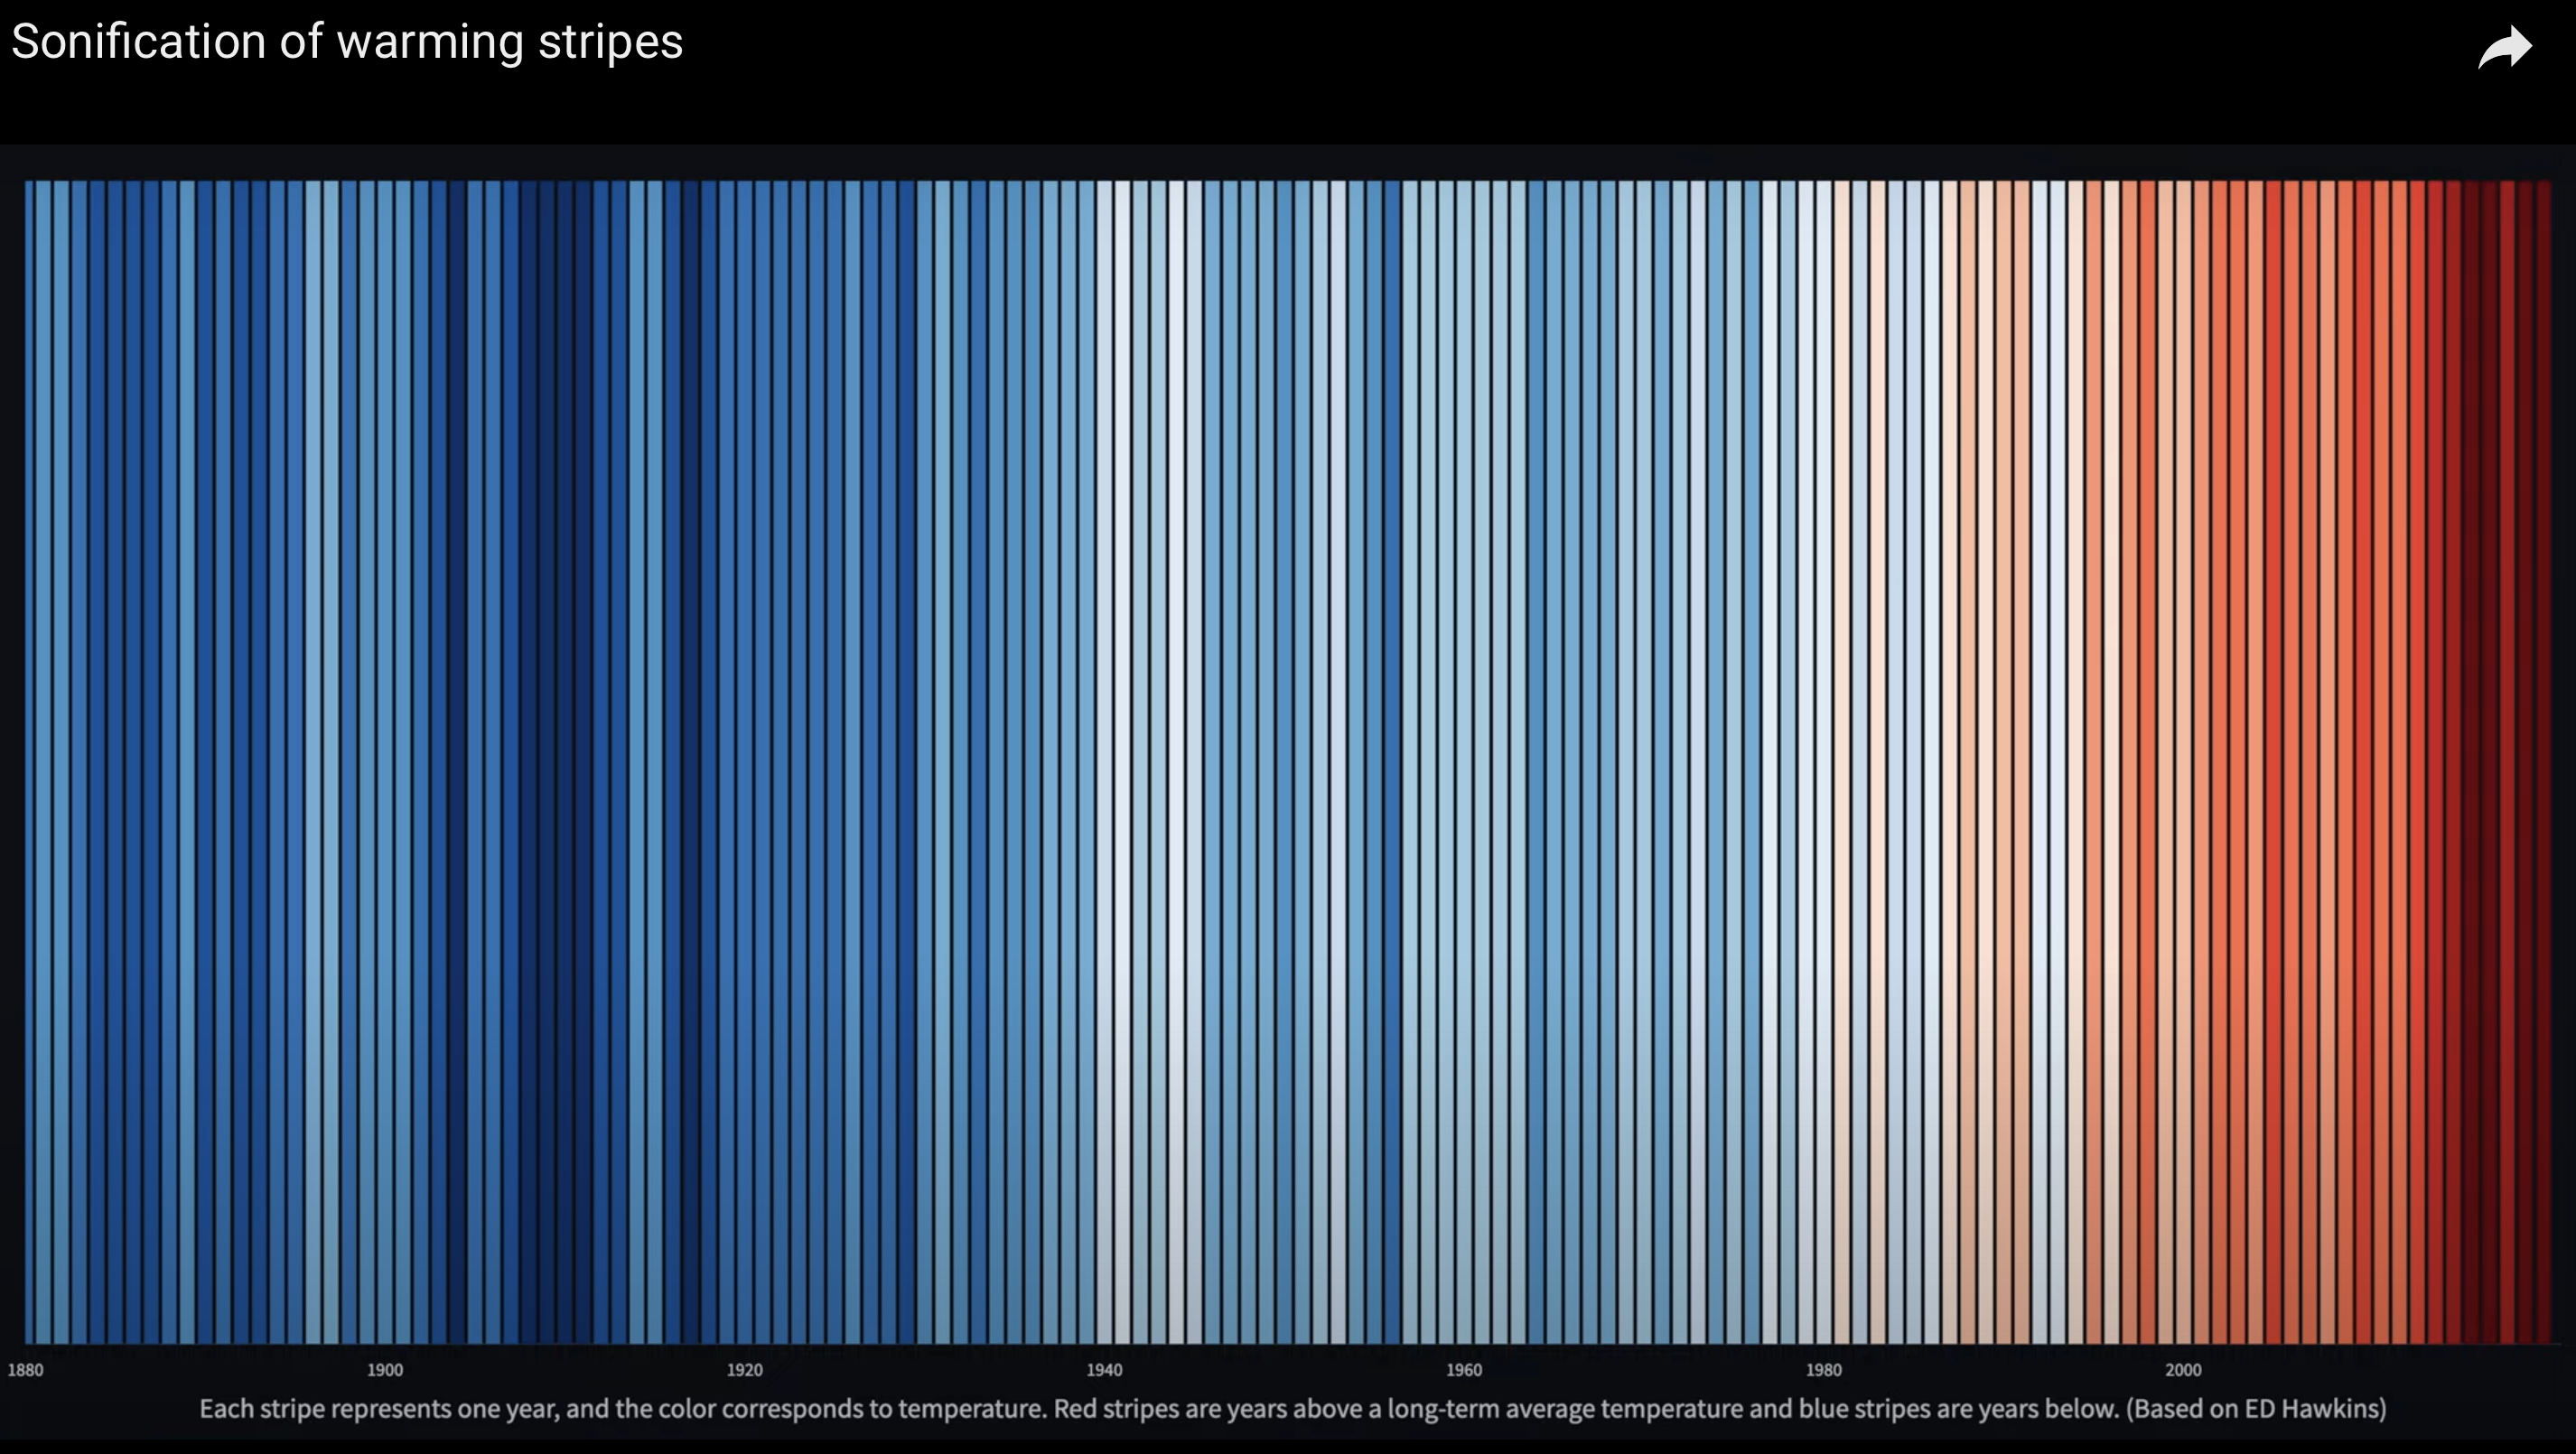
Another compelling example is scientist Dr. Ed Hawkins’s sonification work called the “warming stripes.” The accompanying video depicts temperature trends over time, with each stripe representing a year’s average temperature—blue for cooler years and red for warmer years.
Dr. Amy Bower, through the National Science Foundation’s Advancing Informal STEM Learning Program, led a project focused on sonification of ocean data. The project aims to inclusively design auditory displays of real ocean data. Using datasets from the Ocean Observatories Initiative (OOI), they have worked on translating events like the 2015 eruption of Axial Seamount, zooplankton vertical migration during an eclipse, and carbon dioxide exchange between the ocean and the atmosphere into sound. Their co-design process involves feedback from subject matter experts and educators for the blind and visually impaired, ensuring the final product meets both scientific and pedagogical needs. This project highlights how sonification can make complex ocean data accessible and engaging to a wider audience, including those who are visually impaired.
While scientists are already doing really important, interesting work in the field, data sonification methods for earth science data still require significant advancements to ensure accurate and consistent auditory representations. Developing user-friendly tools will also facilitate accessibility to creating sonification products. Additionally, disseminating the knowledge of how different sound parameters affect perception and cognition among practitioners is essential for designing effective sonifications.
The future of data sonification is bright, and advancements in technology promise innovative applications, especially combined with visualization techniques like virtual and augmented reality. This integration could offer immersive experiences that enhance our understanding of complex data, making sonification a valuable tool in scientific communication.